

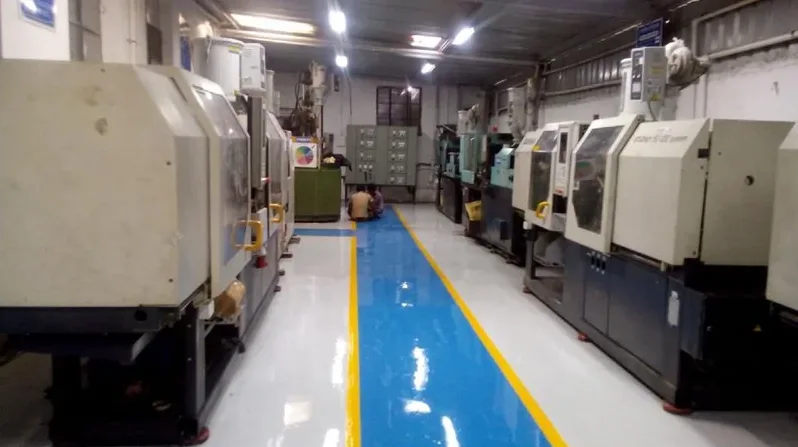
Embedded systems · Firmware · Safety-critical control
Silicon to Cloud. Bench to Field.
Agastix Systems is an embedded engineering company. We take products from concept to the field — electronics, firmware, mobile and desktop software — under one roof.
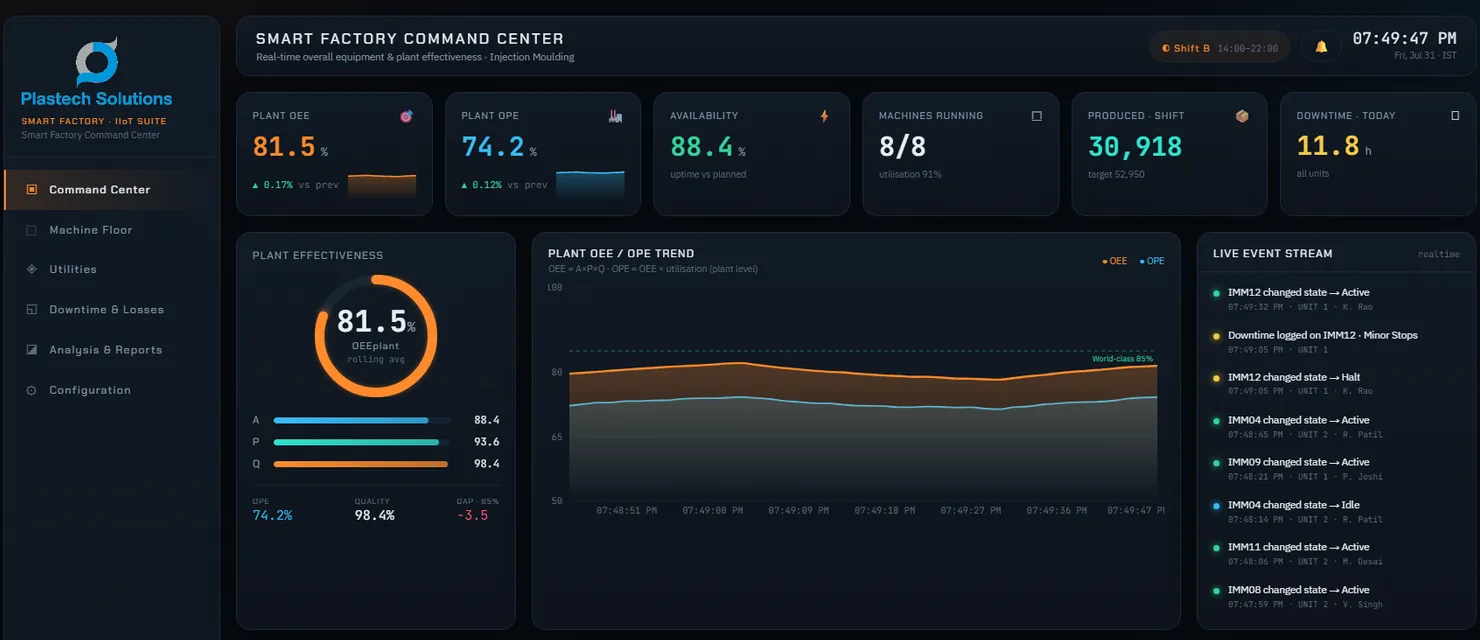
The system in 44 seconds
Plays from YouTube. Footage is AI-generated; dashboard screens are from the real system.
Machine Monitoring System
What the system shows
The same data on the shop floor, in the office and on your phone. OEE (overall equipment effectiveness) is the share of planned time a machine spends making good parts at full speed.
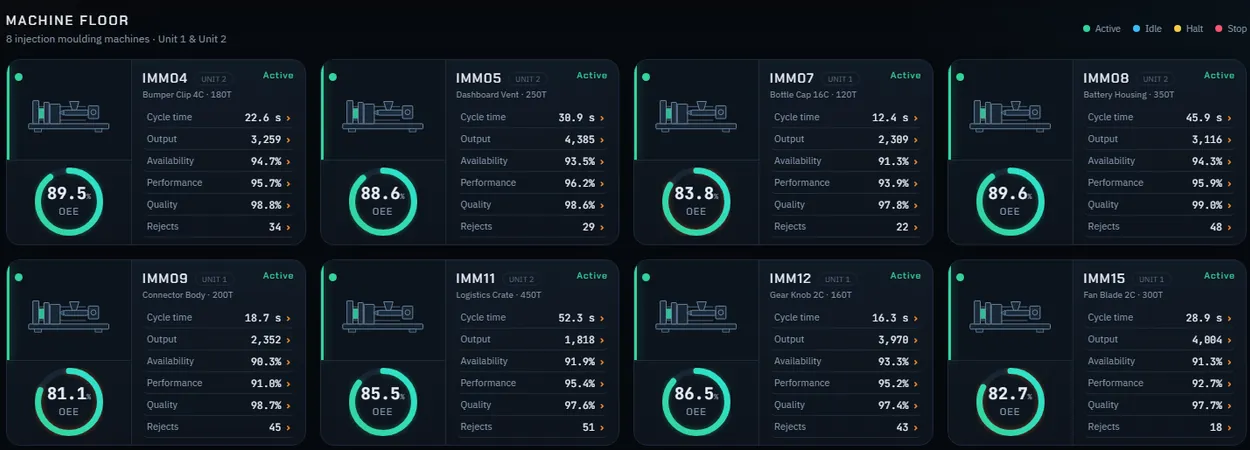
Machine floor
Every machine's state, cycle time, output and OEE on one screen.
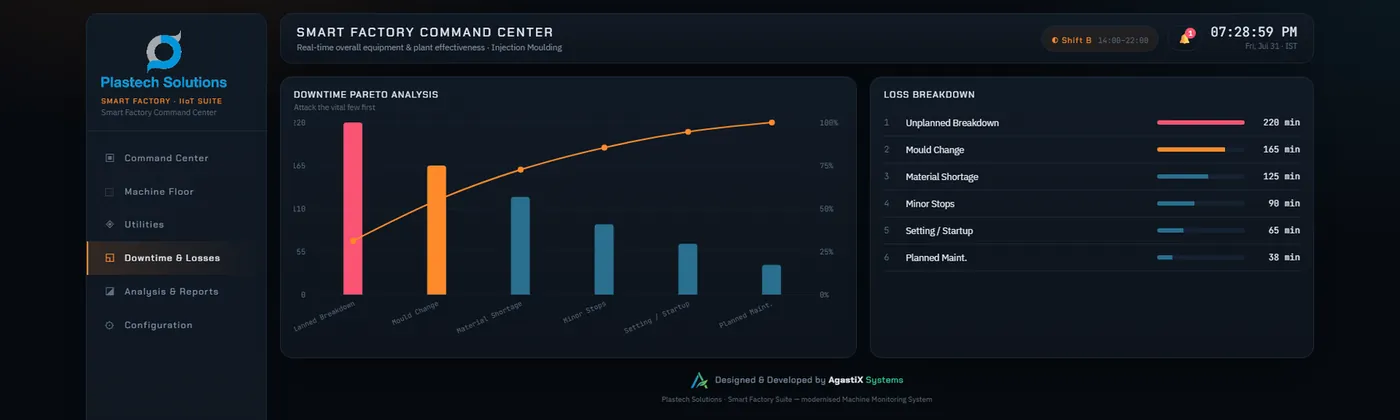
Downtime and losses
A Pareto chart of downtime by reason and by machine.
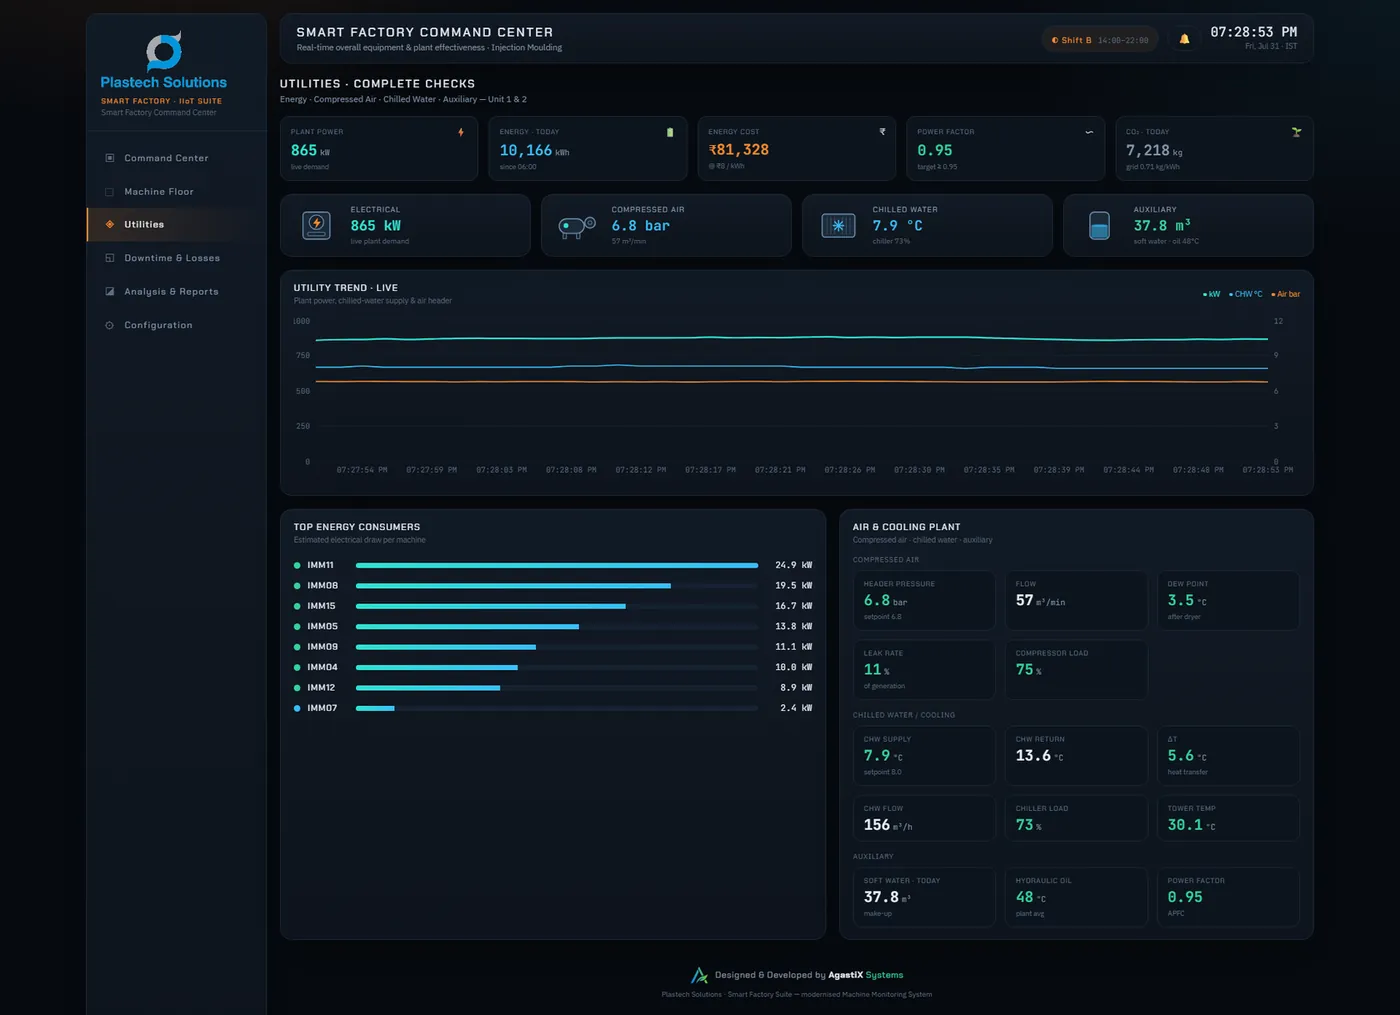
Energy and utilities
Power, energy, compressed air and chilled water, shown alongside production.
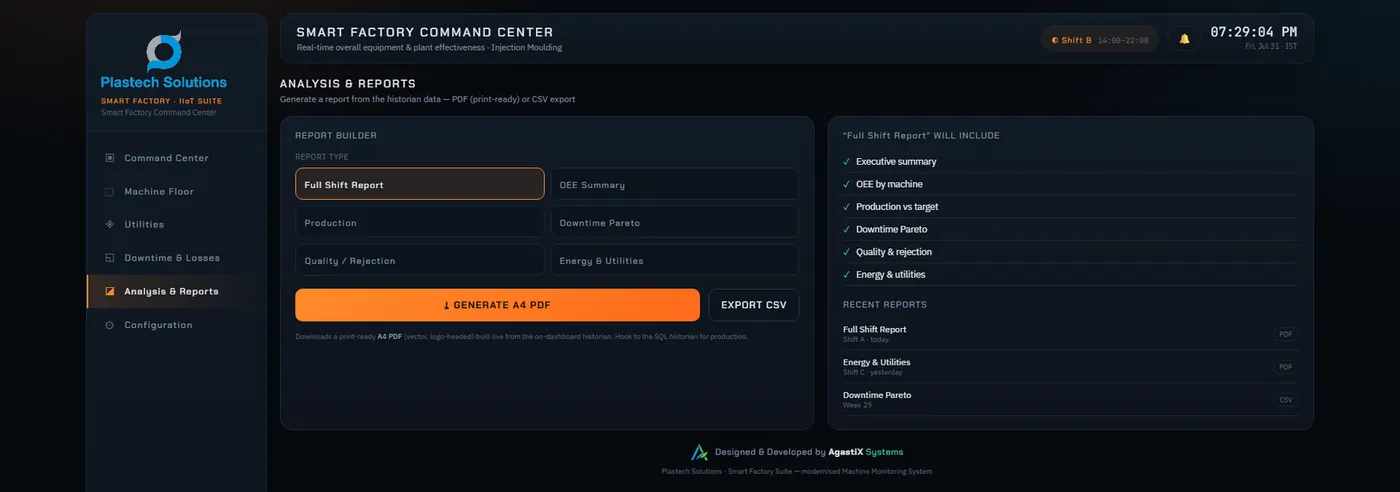
Reports
PDF or CSV on demand, or emailed on a schedule.
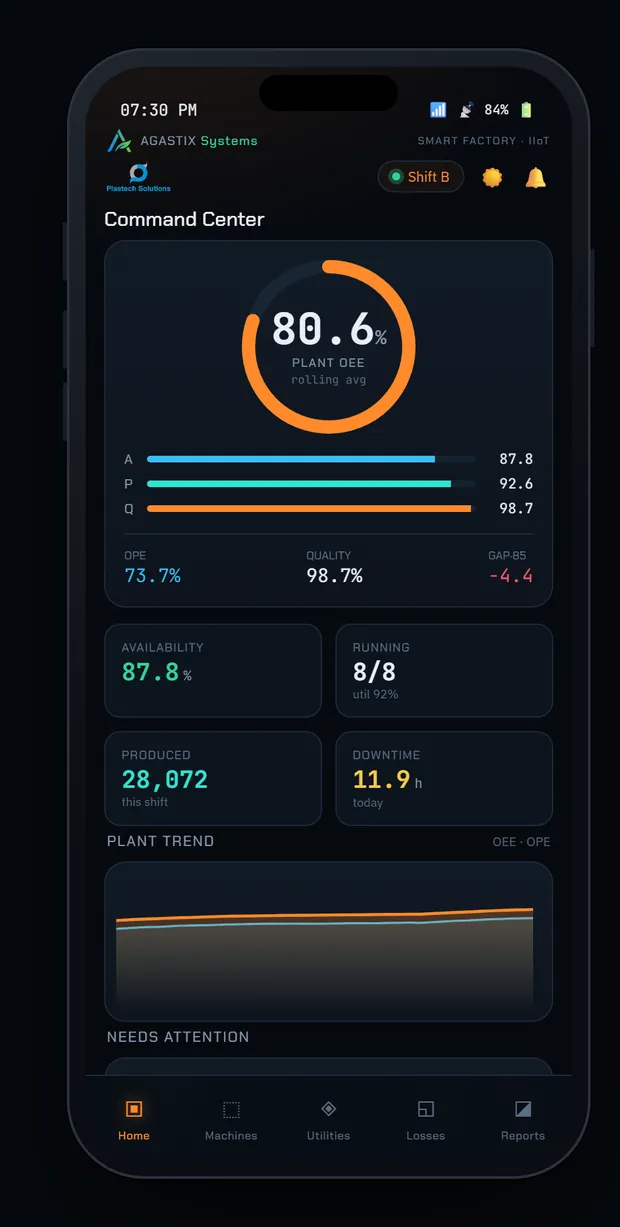
Mobile app
The same data on your phone, with alerts sent to the right person.
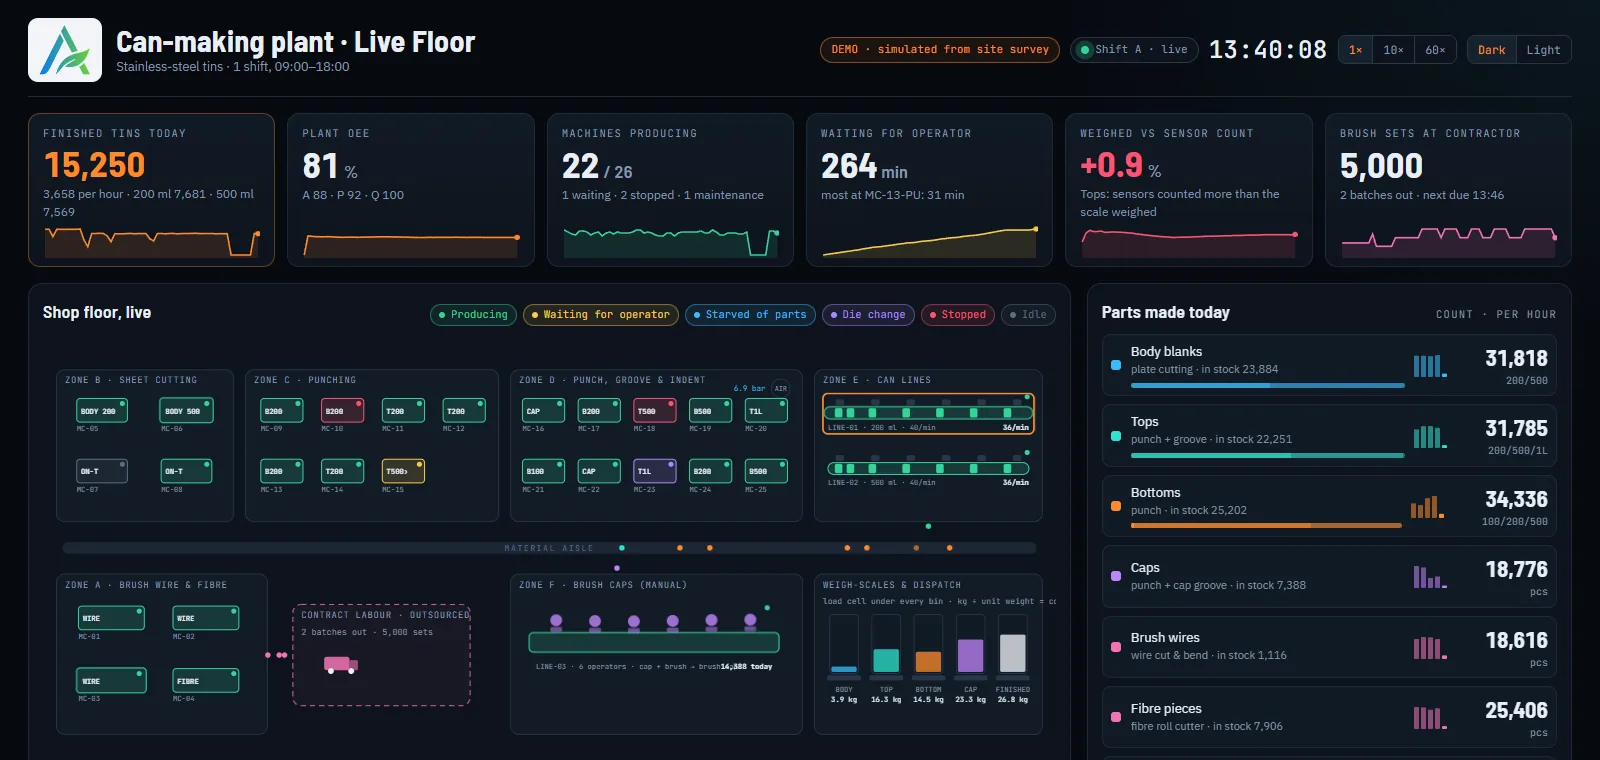
Set up for your process
The same system, configured for a can-making plant: operator waiting time, die changes, and parts counted by weight under every bin.
How data gets from the machine to you
Five stages from the machine to your screens. It runs alongside your ERP and does not replace it.
The machine
Actuator relays, limit switches, controller ports and energy meters already on the machine.
Edge node
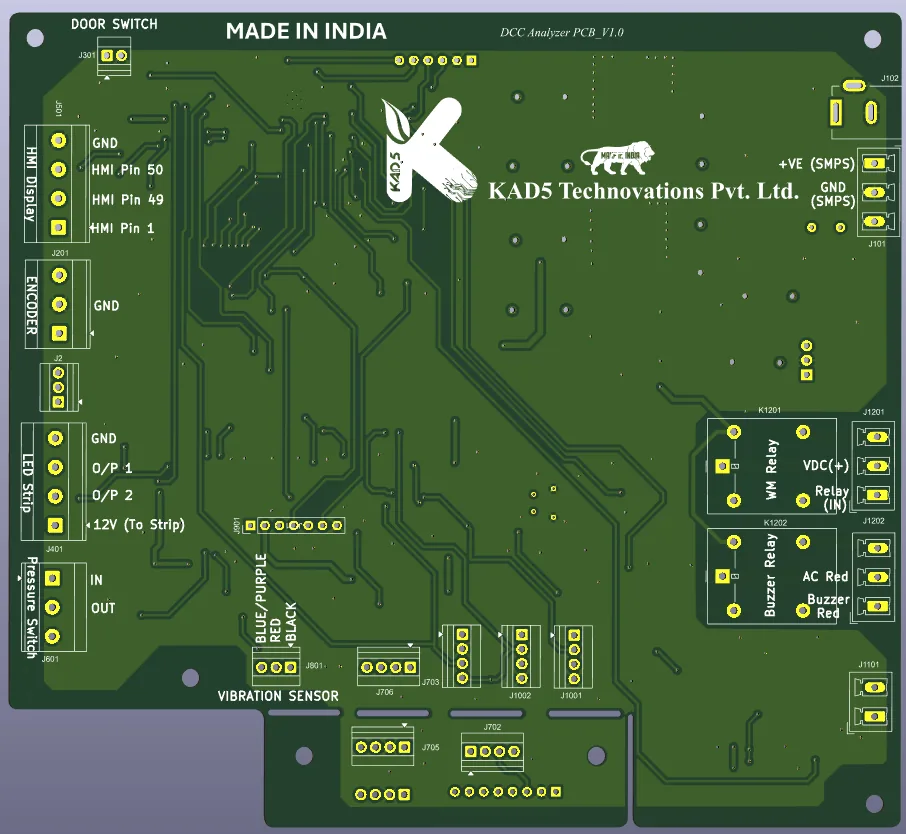
Our board in your panel. Eight opto-isolated inputs, dual RS-485, Ethernet or Wi-Fi.
Secure transport
Encrypted MQTT over your own network. Readings are stored and forwarded, so a network outage does not lose data.
Historian
Every cycle, state change, alarm and meter reading at full resolution, on a server in your plant or in the cloud.
Your people
Shop-floor screens, office dashboards, the mobile app, alerts and scheduled PDF reports.
Where it is different
Real-time data
Losses show up during the shift, so they can be dealt with the same day.
Custom reports
The historian keeps every raw event, so new reports can be built from data already collected.
Brownfield and greenfield alike
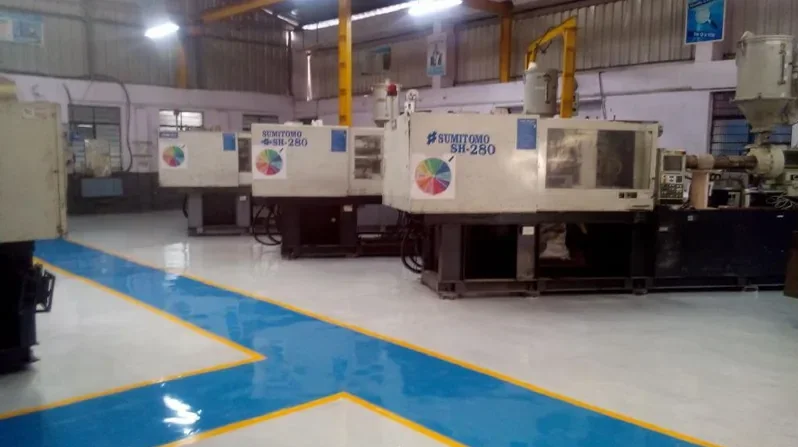
Older hydraulic machines and new all-electric ones appear on the same screen.
Hardware and software from one team
We designed the board, wrote the firmware and built the server and apps, so changes are made by the people who built it.
On-premise or cloud
Run it on a server inside your plant or on a managed cloud account. The screens are the same, and you can switch later.
Configurable for your industry
Works for moulding, pressing, packaging, machining and assembly. The machine cycle is set up through configuration.
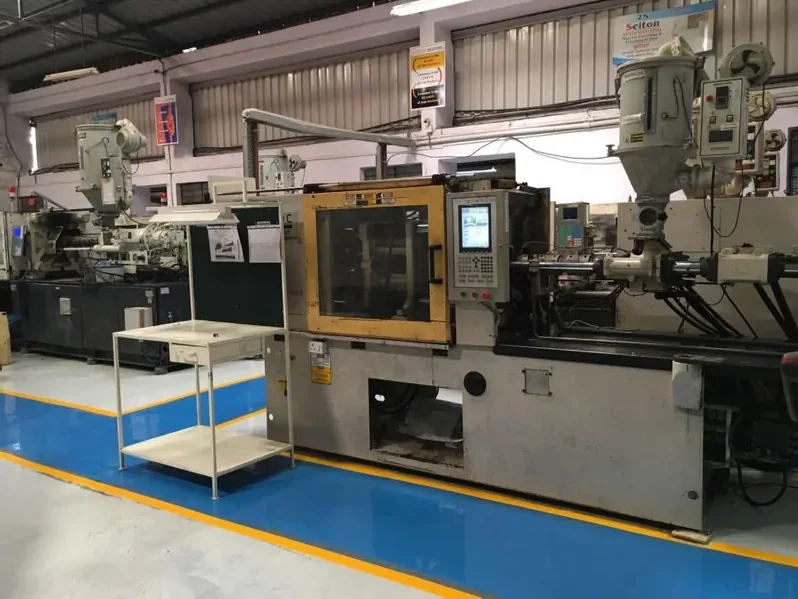
Old and new machines
Older machines are read from their own actuator relays through isolated inputs. Nothing in the panel is rewired. Modern controllers are read over Modbus, Ethernet or the maker's data port, with no duplicate sensing.
- Shift report
- OEE summary
- Downtime Pareto
- Quality and rejection
- Energy and utilities
- Mould and job-wise
- Maintenance due
- Custom reports on request
How a rollout works
- 1
Free site survey
We visit your plant, record each machine, its controller and the signals available, and send you a written proposal.
- 2
Pilot on 2 to 3 machines
Installed during a planned stop and run alongside your current reporting, so you can compare the numbers.
- 3
Plant rollout
The remaining machines are connected in phases, and your team is shown the screens and reports.
Pricing is per machine: one-time hardware and installation, plus an annual support plan. You get a written quote after the survey.
Agastix Systems
Why one vendor matters
Agastix Systems is an engineering company in Pune, led by Parixit Ingle. We built the Machine Monitoring System ourselves, from the circuit board to the app.
One number to call
Hardware, firmware, software, installation and support come from the same team.
Designed in India
The edge node in your panel is our own board, designed in Pune.
Changes made in-house
New reports, screens or machine types are added by the engineers who built the system.
Your data, your choice
Keep everything on a server in your plant, or use a managed cloud account. Reports export to CSV for Excel.
Book a free survey for your plant
Tell us how many machines you run and what type they are. We will arrange a visit, survey the machines and send a written proposal. For custom electronics or software projects, write to the same address.